Solana Price Outlook: Bear Trend Targets $60
SOL Price Action: Seven Months of Decline
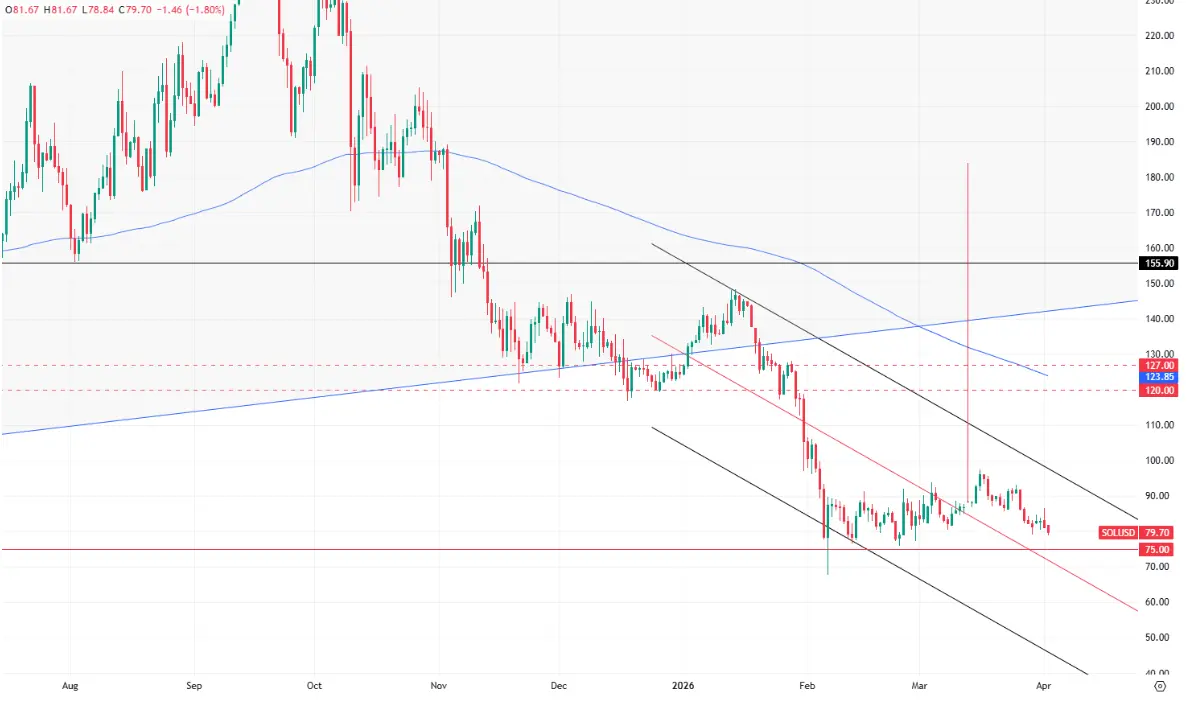
SOLUSD currently trades at USD 82.9 on Binance. SOL dropped 33.4% in full Q1 2026, after trending lower during the whole quarter.
On a longer-term chart, the price action has been in decline for seven consecutive months and is now back at January 2024 levels, effectively erasing all the gains seen over the next 12 months.
Weak On-Chain Activity Signals Demand Drop
In recent developments, the Solana network’s trading volumes have contracted dramatically.
According to expert estimates, turnover last stood at USD 55.5 bn, the lowest level since September 2024.
Additionally, analysts highlight a decline in network fee revenue to USD 18.5 mn in March, down from USD 30 mn in January.
Macro Pressure and Market Outflows
SOL pulled back over 20% in March, marking the worst month of the quarter.
The decline was partly attributable to the onset of the Middle East conflict, which triggered a broad outflow of funds from risk-sensitive assets.
Key Technical Levels: $75 Support and $60 Risk
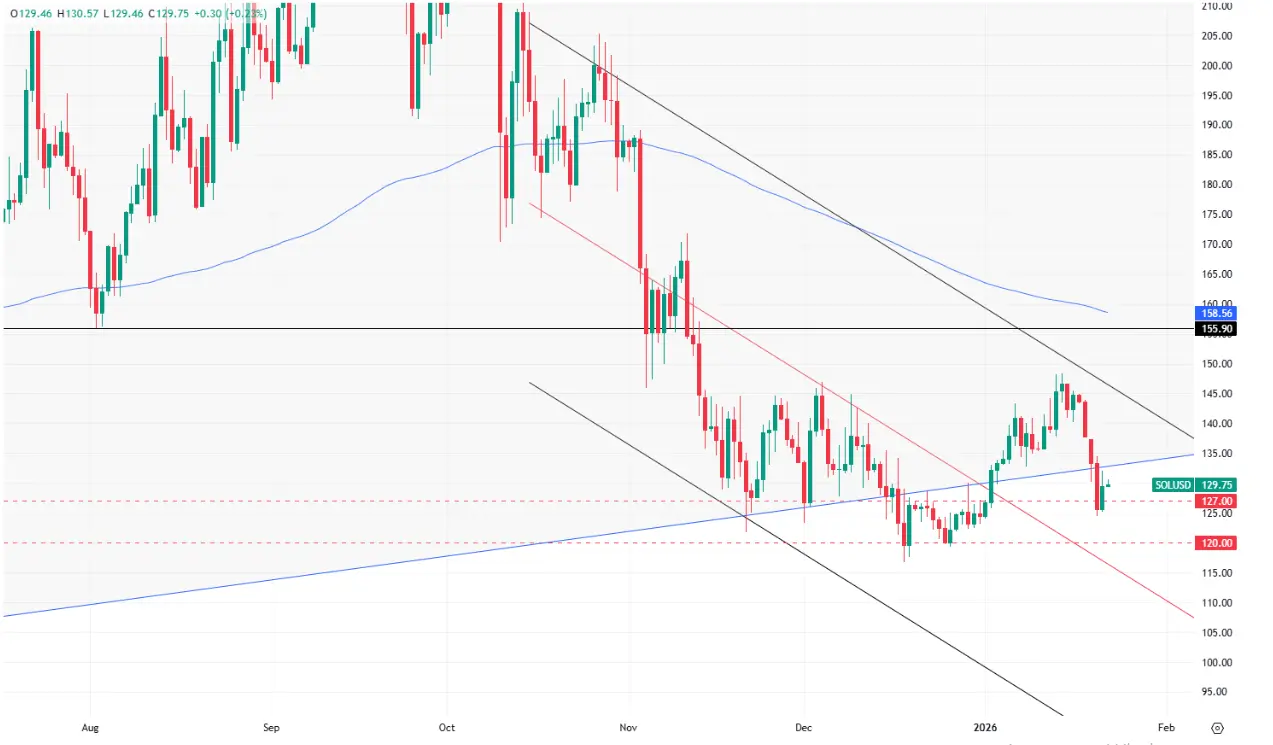
Technically, our previous SOL overview envisaged two possible scenarios: retracement to an upward trajectory after breaking above USD 160, or an extension of the downtrend toward the USD 100 target.
The latter scenario ultimately played out, with the SOL curve having formed support in the USD 75-80 range since early February 2026.
Notably, the token showed comparable momentum in January 2024 as well as in February-March 2022.
A breakdown from this range could see the bears setting their sights on USD 60, whereas a reversal to the upside would set the stage for a retracement towards USD 120.
The trend still remains bearish across all timeframes, meaning that sellers may use sporadic price rebounds to build up short positions and continue exerting downward pressure on the market.