Solana Price Outlook 2026: Bullish vs Bearish Scenarios
Solana’s 2025 Performance: A Year of Reversal
SOLUSD on the Binance exchange ended 2025 34% lower, partially unwinding the 85% gain posted in 2024.
The weakest periods for SOL were Q1 and Q4, with the steepest monthly declines recorded in February (-36%) and November (-29%).
Historic Year-End Weakness
Notably, this was not the first time the token had turned south heading into year-end.
For instance, the price fell 18.6% in December 2021, more than 86% in November through December 2022, and 20.5% in December 2024.
The exception was full-year 2023, when the pullback got underway in January 2024 and was still relatively mild.
Catalysts Ahead: Firedancer and Alpenglow
Experts highlight plans in place to roll out Firedancer and Alpenglow during 2026.
Firedancer is expected to deliver significantly higher throughput for Solana, while Alpenglow should materially boost speed and enable high-frequency trading (HFT) capabilities.
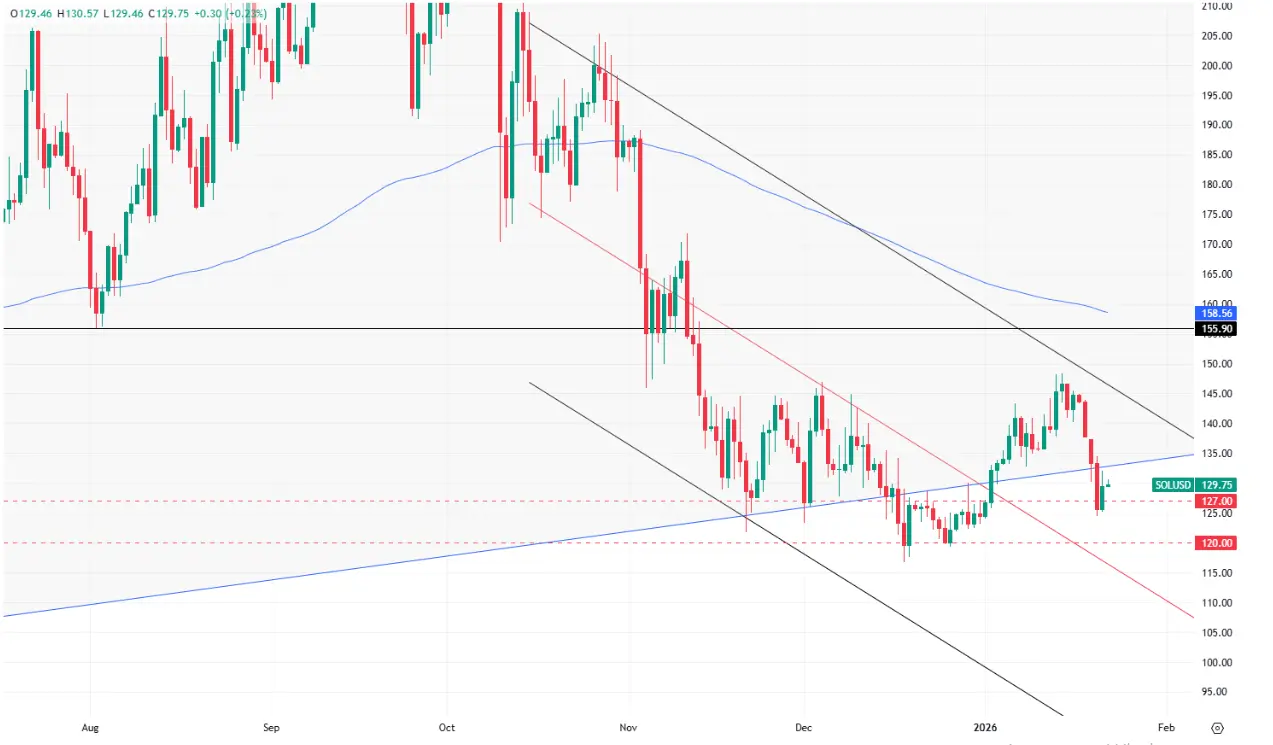
Technical Breakdown: Key Levels to Watch
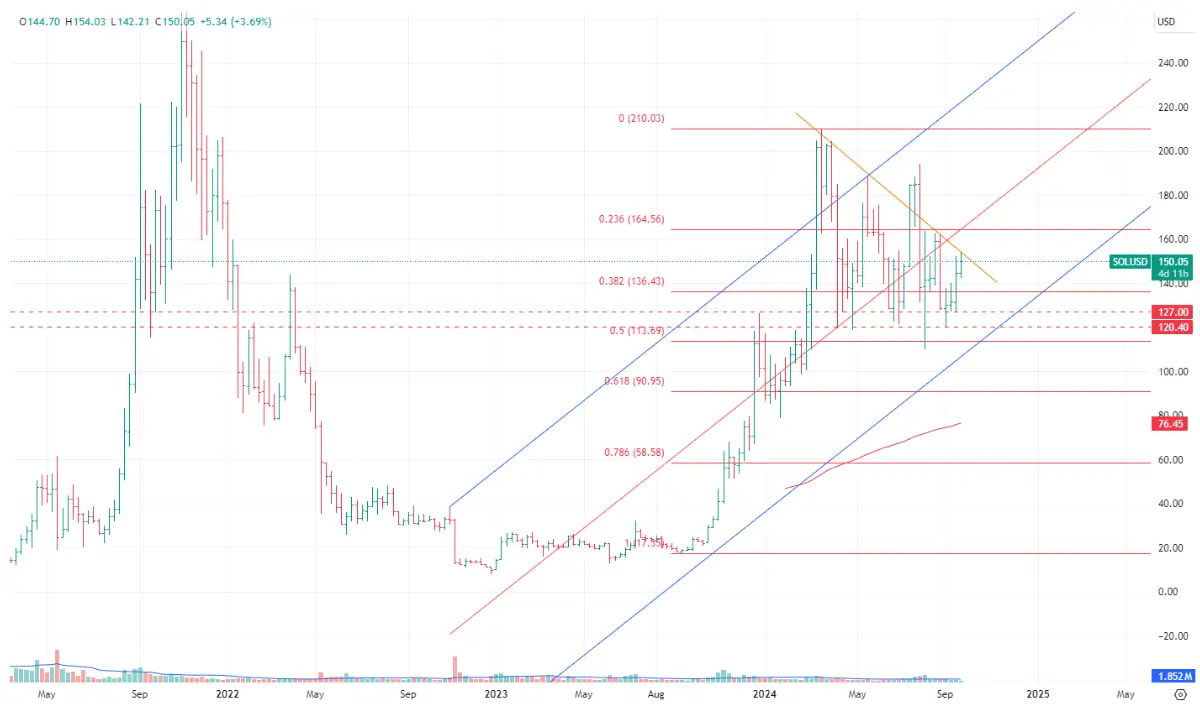
From the technical analysis standpoint, our previous SOL overview covered an alternative (bearish) price path with the possibility of a move below USD 180.
While we labeled it as unlikely, that scenario eventually played out and was followed by a breach below USD 155.9.
The price action has recently dropped to the lower bound of the current channel toward the USD 120-127 support range.
Two scenarios could be in the cards again.
Bullish and Bearish Scenarios for 2026
The bullish case implies a retracement to an upward trajectory. Drawing on the short-term trend, this outcome looks less likely, as the 200-day MA is still sloping downward.
Nonetheless, the medium-term weekly chart reveals the odds of a rebound.
Therefore, confirmation is needed before considering opening long positions.
In our view, such confirmation would be a breakout above USD 148-150, or better still, a retracement to levels above USD 160.
The bearish scenario implies an extension of the downtrend toward USD 120 and, longer-term, toward the key USD 100 level.