AVAX Price Outlook: NYSE Plans and Key Resistance
AVAX Remains Under Pressure in 2026
As of November 11, 2026, AVAX is down more than 30% since the start of the year on Binance. The bearish trend that began in 2024 has continued.
Q1 has been the weakest quarter so far this year, with a decline of 27.7%. However, the year is not yet over, and the bears could push prices lower over the remaining month and a half. The token has fallen 22% since October.
NYSE Plans to Use Avalanche Technology
In early November, the NYSE announced plans to use Avalanche technology for the core ledger of its upcoming platform. The platform is being developed to support round-the-clock stock trading, clearing and settlement.
However, the project has not yet obtained regulatory approval, which remains an important risk.
Why Adoption May Not Guarantee AVAX Demand
Crypto analysts have highlighted two important details about the project.
First, transaction fees and settlements within the NYSE network could be paid using other tokens. AVAX could therefore face competition, and stronger demand for the token is not guaranteed.
Second, the project would use a dedicated, custom Layer 1 network with controlled access, rather than Avalanche’s public mainnet.
November’s Rally Stops Short of the 200-Day Moving Average
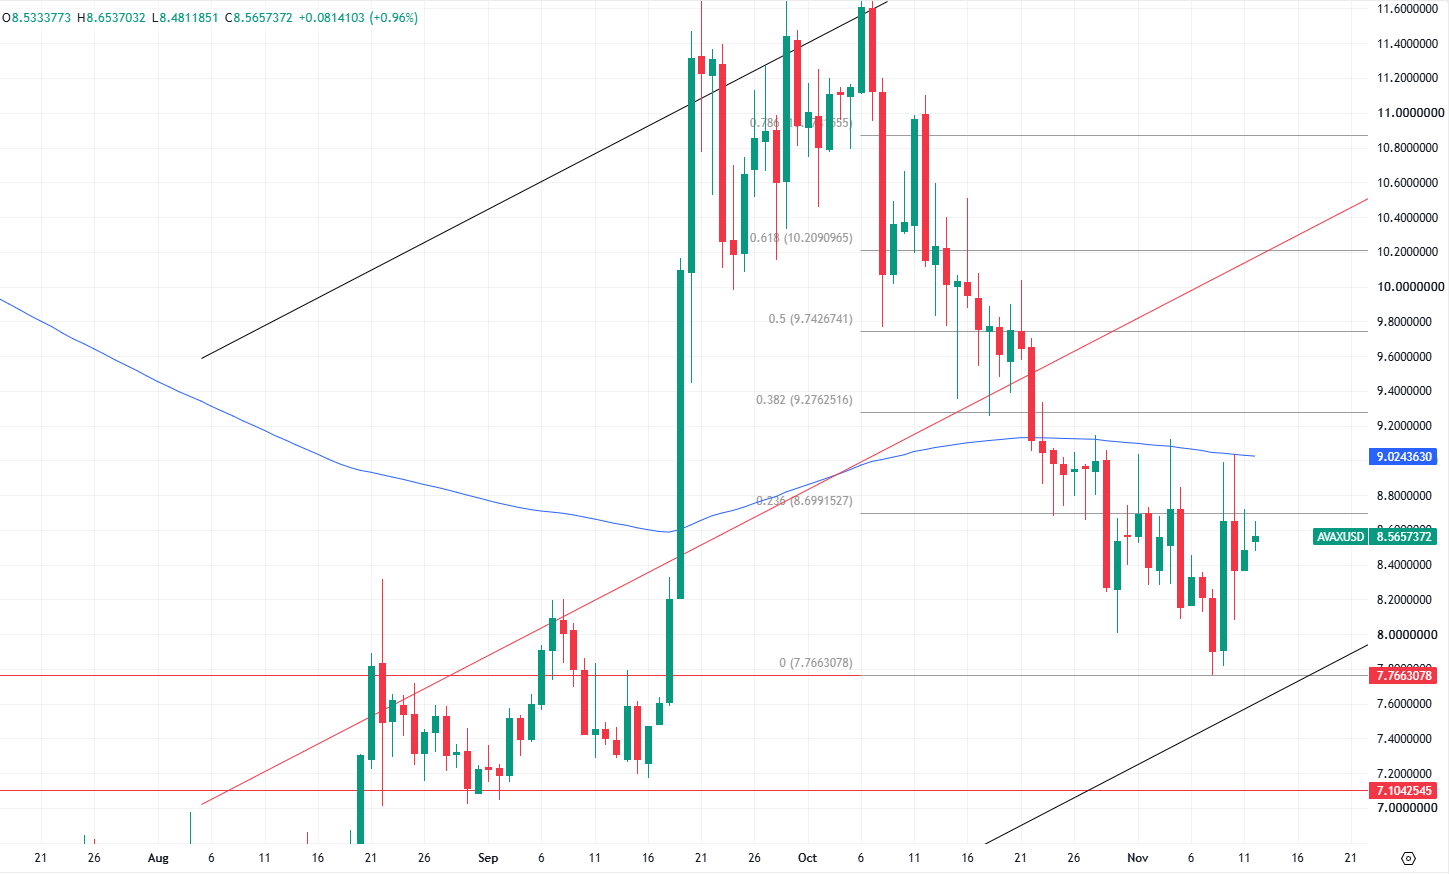
AVAX rose 9.4% on November 9, but the jump did not develop into a sustained rally or accelerating market capitalization growth. It also failed to produce a breakout above the 200-day moving average.
Even so, the daily chart continues to show potential for further gains.
AVAX Technical Levels: $7.76 Support and $9.02 Resistance
On the short-term chart, the regression channel retains a positive slope, with each successive local low still higher than the previous one.
The nearest horizontal support level lies around $7.76. Resistance is near $9.02, where the 200-day moving average stands.
The token is hovering near the 23.6% Fibonacci retracement level at approximately $8.70.