
📉 TONCOIN Analysis: Market Decline, Durov’s Vision, and Future of Telegram’s Financial Platform
The situation with TONCOIN looks negative, but still not critical. The coin has been declining for the third month in a row. August, without a doubt, is currently becoming the worst month for market participants this year – TONCOIN has dropped by almost 20%. However, it is still far from the record crashes observed in the market in 2022.
📊 Historical Performance and Recent Correction
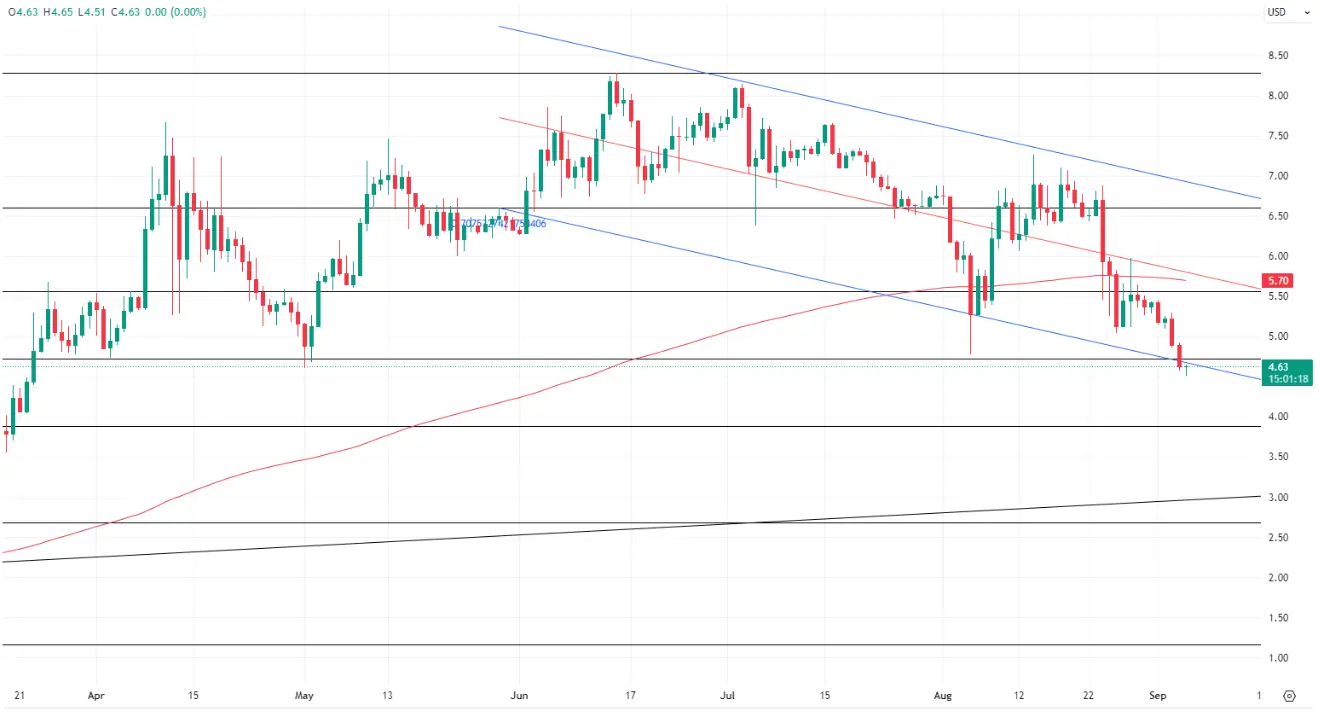
In the first half of 2022, TONCOIN’s drawdown in some months reached 26-28%. At present, the price has corrected by about 50% from the growth that began in August 2023 until TONCOIN reached its highest-high on June 15, 2024.
📰 Impact of Durov and Telegram’s Future
The current market sentiment is predominantly shaped by events related to Pavel Durov and rumors about the future of Telegram. Initially, Durov envisioned TON as the foundation for his financial system, independent of the global financial network.
💸 Potential of a Payment System on TONCOIN
The main project was supposed to be a payment system based on TONCOIN with support for external payments, which could transform Telegram into a financial platform. This could have been one of the reasons for Durov’s arrest, with accusations including the refusal to provide data to authorized bodies upon request.
🔍 Key Scenarios for TONCOIN’s Future
Thus, TONCOIN’s behavior is currently determined by events surrounding the founder of Telegram. In our opinion, there are only two possible scenarios for further developments:
🕊️ Scenario 1: A Deal with the Investigation
A deal with the investigation. In this case, Durov will likely be allowed to leave France. This could positively affect the price, and we may see a reversal and continuation of the bullish trend.
🚫 Scenario 2: Refusal and Detention
Refusal to make a deal and Durov’s detention. This scenario will undoubtedly be negative for TONCOIN, and the price could fall even further.
🗳️ External Influences: USA Presidential Elections
We do not rule out that the likelihood of one scenario over another could be influenced by the domestic political situation in the USA. Thus, the upcoming Presidential elections in November could also act as a trigger for market participants, although this is not certain.
📈 Technical Analysis: Current and Future Price Levels

Technically, the coin has broken through its 200-day moving average and, as we mentioned before, has reached the 50% correction level (marked at $4.7). The lower boundary of the regression price channel, which is directed downward on the 1D timeframe, is also located there. Currently, trading is taking place slightly below $4.7, meaning the level break is confirmed; however, it could turn out to be false. Thus, from a technical standpoint, there are also two possible scenarios:
📉 Scenario 1: Continued Decline
The price may continue to decline. In this case, the next strong support level will be at $3.9 – these are the levels of March 2024. If it falls below this mark, the price is highly likely to drop below $3, approximately returning to February values.
📊 Scenario 2: False Break and Rebound
The break is false. In this case, the price should confirm this soon and return above $4.7. Then the bulls’ target will become $5.7, where the 200-day moving average is currently located.
🚀 Long-Term Trend and Position Sizing
It is worth emphasizing once again that despite the short-term “daily” bearish trend, the trend on higher time frames is still bullish, and we are just observing a correction. This fact should also determine the position size when opening trades. Some asymmetry in favor of long positions is possible.


