
Keeta Token Analysis: RWA Rally Hits $1.7 with 360% Gains
The RWA Market Surge: Keeta’s Position in a $38.6B Sector
Keeta operates within the Real World Asset (RWA) token segment.
Some experts note that the total market capitalization of these tokens has reached $38.6 bn, potentially supporting their long-term growth.
Keeta’s Explosive Rally: From Underdog to 360% Winner
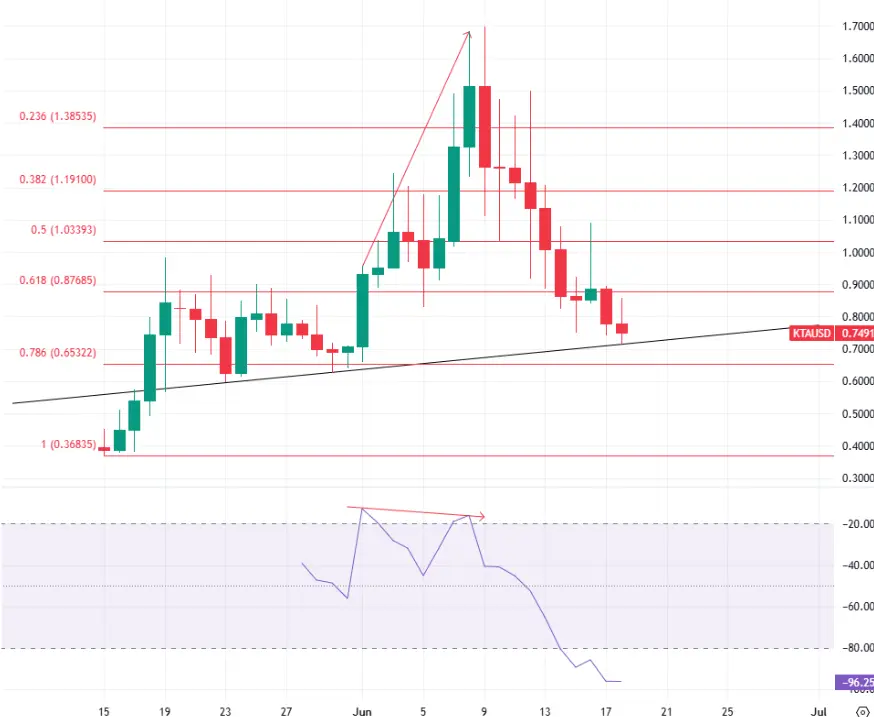
That said, Keeta was in rally mode between May 15 and June 9 as the price action nearly hit $1.7, delivering over 360% upside.
According to industry analysts, the list of drivers included a successful trade whereby a single player boosted their deposit through a long position on KTA.
Technical Analysis: Key Support and Resistance Levels
Technically, the four-hour chart shows that the token has pulled back towards a trendline with a positive slope, though the regression channel is tilted downward.
Local support lies at $0.7210. If the bears can breach and hold below this level, the next target will be $0.6532, the 78.6% Fibonacci retracement from the May 15-June 9 rally.
In the event of a breakout above the trendline, local resistance lies around the moving average at $0.85, followed by $0.8770.
Williams %R Indicator Signals Potential Reversal
On the daily chart, the Williams %R indicator has been trending lower and is potentially poised for a reversal after lingering in oversold territory for an extended period.
The indicator proved a reliable predictor for the token’s performance from June 1 to 10 when the price action deviated from its recent average and then pulled back.
During this period, Williams %R formed a classic double top pattern.
Traders are advised to factor these findings into developing short-term strategies for Keeta.