Gold Rally 2025: Drivers, Outlook & Elliott Wave Cases
Overview: Gold’s 2025 Boom
Gold (XAUUSD) climbed nearly 65% in FY 2025 – the strongest gain since 1979. XAUUSD drew support from a confluence of factors.
Dollar weakness. The DXY index posted its worst performance in years during 2025 and continued to ease into 2026.
Geopolitical tensions. 2025 saw escalation in the Middle East, with Israel and Iran embroiled an all-out war that lasted just 12 thanks to Trump’s peace-making initiative.
Early 2026 witnessed US threats to strike targets across Iran.
On top of that, US forces captured and brought Venezuelan leader Nicolas Maduro stateside in January.
President Trump pressed ahead with his claim that the US must gain control over Greenland.
These developments have prompted investor to reallocate funds into safe-haven assets, including gold.
Macro Forces Behind Gold’s Surge
Trade wars. President Trump has been on a mission to protect the US market, weaponizing tariffs vis-à-vis trading partners across the globe.
This shift in trade policies boosted safe-haven interest as well.
Rising precious metals demand. Market participants have been snapping up precious metals like never before.
Data from the World Gold Council shows that gold demand topped 5,000 tons in FY 2025, driven by ETF inflows and central bank purchases.
Political & Geopolitical Impacts
Domestic political turmoil stateside. Beyond geopolitical and macroeconomic factors, precious metals have drawn support from political uncertainty stateside.
A case in point is Trump’s continued efforts to undermine the Federal Reserve’s independence, including accusations against Chair Jerome Powell for pausing rate cuts.
With Powell set to step down later in 2026, Trump nominated Kevin Warsh as new US central bank chief.
Markets are now pricing in the odds of faster policy easing, which would step up downward pressure on the dollar.
FOMO. Gold’s stellar performance last year triggered a FOMO effect.
And although the market has lapsed into a downward correction, speculative demand may be reignited anytime soon.
Technical Analysis With Elliott Waves
Technically, traders are advised to leverage Elliott Waves for a longer-term outlook. Notably, this theory offers multiple scenarios, which require adjustments depending on an array of factors.
The first assumption holds that gold prices will remain within a trend impulse.
This scenario looks highly feasible, an assumption inferred from the nature of price movement – a massive upsurge on substantial volumes.
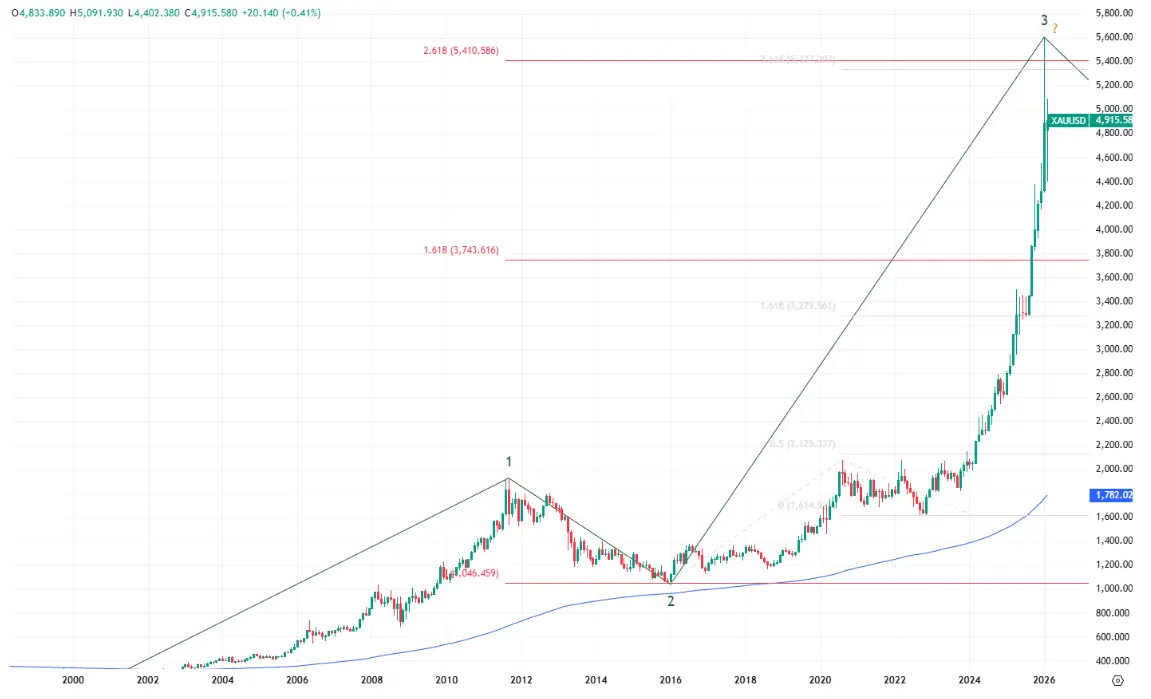
Given the market’s behavior in recent months, the gold price is currently in the 3rd impulse wave.
As per classic wave theory, the 3rd wave tends to be the strongest and often extended in time.
Moreover, waves relate through Fibonacci ratios (with some margin of error), which can signal wave endings.
If we peg the start of the impulse to the low-price environment in 2001-2002, and count the 2001-2011 rise as the 1st wave, then the current 3rd impulse wave has reached 261.8% of the 1st wave (at USD 5,400/oz), consistent with the theory.
Future Scenarios for Gold Prices
We outline two potential scenarios:
Scenario 1. The 3rd wave is over, with the price action entering the 4th wave, which could presage a deep downward correction.
According to the wave analysis theory, corrective waves typically span 38.2% to 61.8% of impulse waves, suggesting that the gold price could drop to a range between USD 2,780 and USD 3,870/oz, or roughly 40% off the current levels.
Scenario 2. The 3rd wave is still ongoing, with the yellow metal set to extend the uptrend.
Under this bullish outlook, the price action could eventually reach USD 6,500/oz.