
Ethereum Surges 44%: Institutional Interest Drives Record Growth
November’s Historic 44% Rally: Catalysts and Context
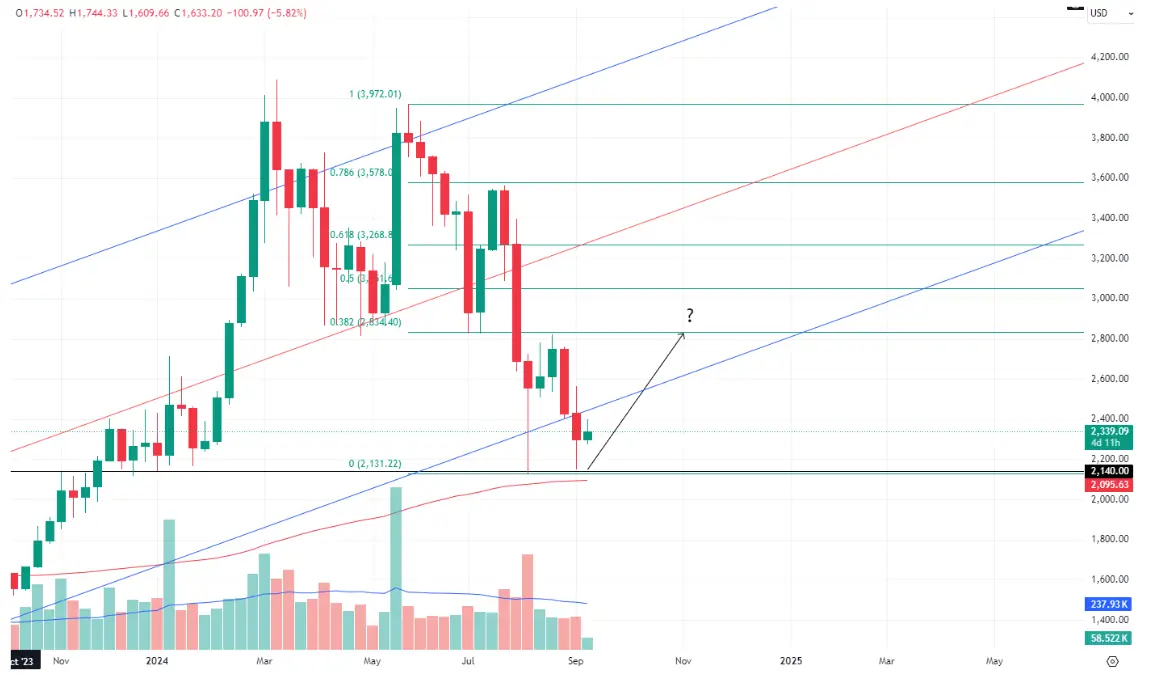
In September, Ethereum grew by 3.5%, but in October of this year, almost all of the coin’s growth was wiped out. November was the real heyday of ETHUSD. Ethereum grew by more than 44% and is currently trading around $3630.
We observed comparable growth in ETHUSD only in February of this year (+46.4%), and before that only in July 2022. The key driver of Ethereum’s growth, as in the case of Bitcoin, was the results of the US elections.
Institutional Investment: Record ETF Inflows and Market Sentiment

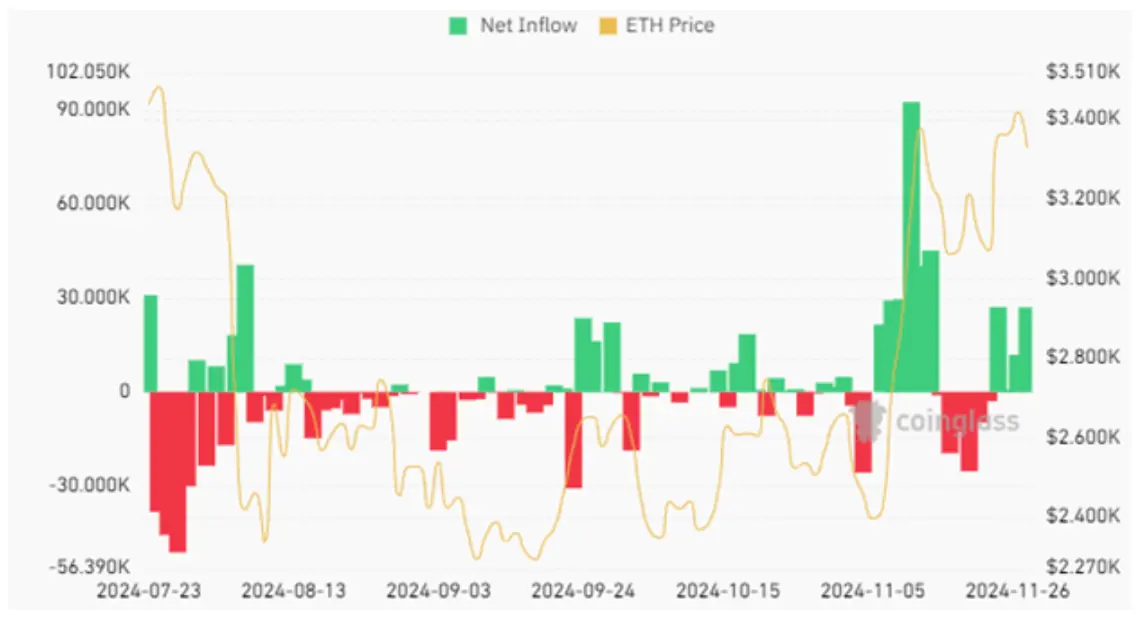
Thus, the largest net inflow of funds into spot ETF funds occurred on 11.11 (+$295.5 million), 12.11 (+$136 million), and 13.11 (+$147 million).
As Bitcoin grows, which, let us recall, has come close to the $100,000, open interest in Ethereum has also grown.
Sygnum Survey: Institutional Adoption Trends
Swiss cryptocurrency bank Sygnum surveyed 400+ respondents from 27 countries.
According to the survey, the central topic at present is the issue of diversification of funds and the possibility of mitigating recession and geopolitical risks.
Bitcoin is considered by many respondents to the survey as an analog of gold. 60% of institutional investors hold long positions in cryptocurrencies.
Technical Analysis: Support Levels and Price Targets
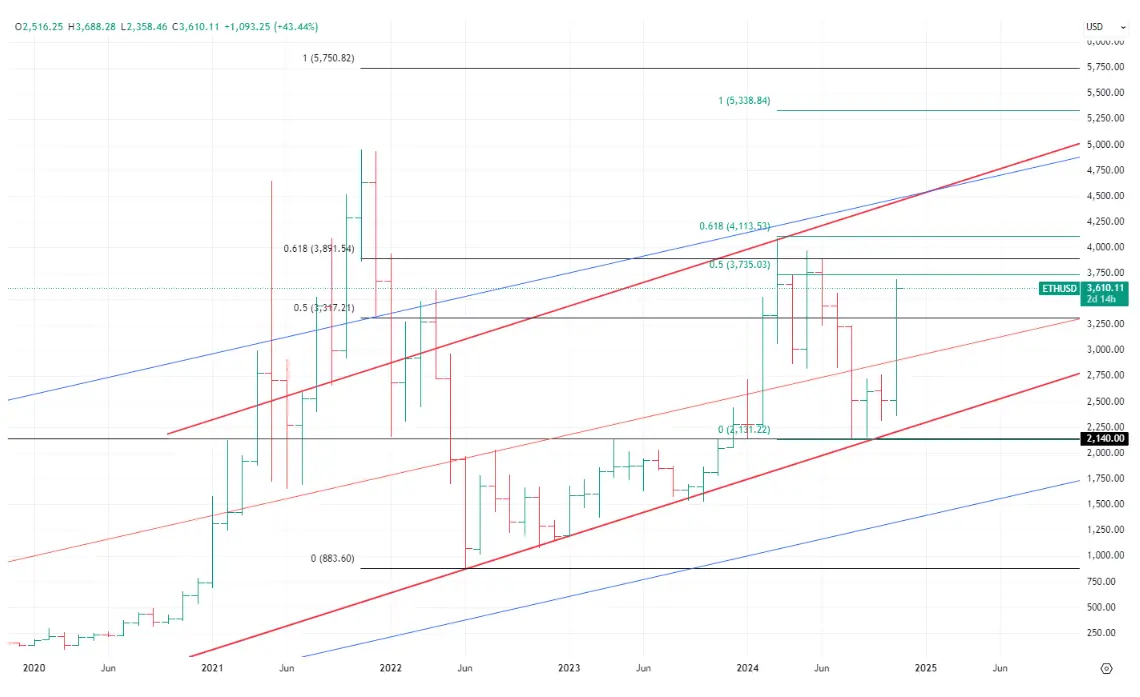
To assess the further prospects for ETHUSD movement, we suggest looking at the long-term monthly chart of ETHUSD.
From June 2022 to September 2024, Ethereum formed several local lows, through which a fairly stable trend line can be drawn.
The same trend line can act as the lower boundary of the price channel for the price (highlighted in bold red on the chart). Thus, the support level for the price is around $2,210.
The intermediate resistance level (the closest obstacle that the bulls need to overcome) is about $3,735.
Then the target is the $4,090 - 4,115 cluster - this is not a historical maximum, but a fairly significant mark, having overcome which the bulls will open the way to $4,400-4,500.
Growth Outlook: Path to $4,500
We have a positive outlook on the medium-term price action track and believe that the likelihood of continued growth in ETHUSD is quite high.


