Ethereum Price Outlook: Key Supports and Scenarios
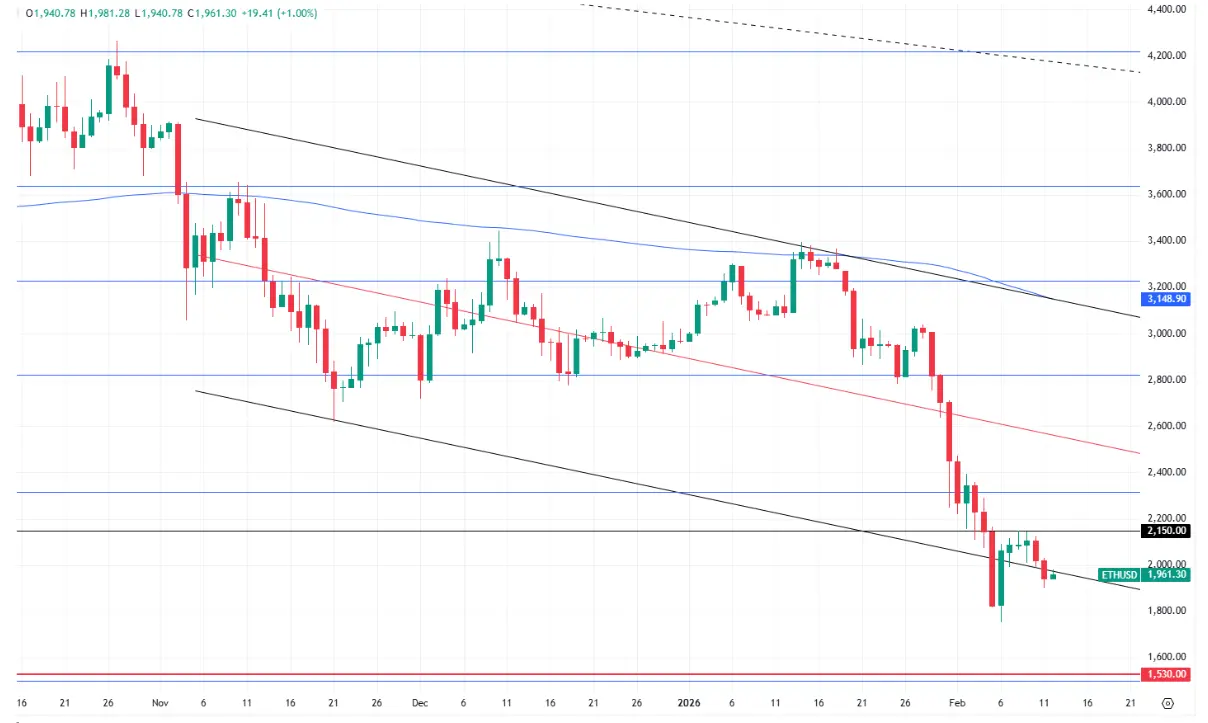
ETH Performance Since FY2025 Close
Ethereum (ETH) closed 11% lower in FY 2025 and has continued to slide this year.
The price action was last hovering below USD 2,000, at levels last seen in May 2025.
ETF Flows and Whale Positioning Signals

Crypto watchers note that the token has fallen beyond the average entry price for whales and ETF players.
Nonetheless, investors have been occasionally returning to spot ETFs – in apparent attempts to leverage the pullback for averaging down and building positions.
Supply Outflows to Cold Wallets and Staking
Additionally, crypto analysts highlight a massive outflow of tokens into cold wallets or staking, which we would label a price-supportive factor because such moves reduce potential supply in the market (with fewer potential sellers in play).
Specifically, February 5 saw a net outflow of 158,000 tokens.
Technical Breakdown Below Key Fibonacci Level
Technically, our December 2025 overview assumed a decline toward USD 2,750, where the key 61.8% Fibonacci level was located, as the most likely scenario.
In January 2026, ETH broke below that level. As a result, the downside reversal that got underway in September 2025 can no longer be treated as a correction relative to the prior up-leg from Q2 and partly Q3 of last year.
Despite this bearish short-term momentum, it is too soon to look for a turnaround of the long-term uptrend, as clearly seen from the positive slope of the regression channel.
In our view, that breakdown would only occur if the price action falls below the USD 1,500–1,700 range.
Support Zones and Forward Price Scenarios
At this point, two plausible scenarios are on the table.
In the first case, ETH could decline into USD 1,500-1,700 territory, rebound and then retrace to an ascending trajectory, forming a classic double bottom pattern on the chart.
The first upside targets on that path forward would be USD 2,150 and USD 2,820.
Alternatively, in a seemingly less likely scenario the price action could break below the support range, with the next downside target around USD 1,000.