Ethereum Price Analysis: Key Support at $3K Amid Market Uncertainty
Ethereum’s Early 2024 Performance Overview
Ethereum kicked off this year in negative territory. Importantly, this was an extension of the downturn that started in December.
As a result, ETHUSD has declined over 17% in the past two months. Since early 2024, the token has gained 46.1% – still stellar but not record-breaking performance.
Historical Pattern Analysis: The Two-Year Cycle Theory
Except for 2019 when ETHUSD was virtually unchanged, the price action has shown a peculiar albeit yet to-be-confirmed pattern: a two-year uptrend in Ethereum is followed by a one-year downturn.
If this is the case, ETHUSD looks set to trend lower during 2025.
Market Response to Political Changes and DeFi Developments
The state of play in the cryptocurrency market has been little changed after Donald Trump took office on January 20.
In positive news, the DeFi World Liberty Financial (WLFI) platform ramped up its reserves by USD 47 mn worth of ETH on the occasion of the 47th US president’s swearing in ceremony.
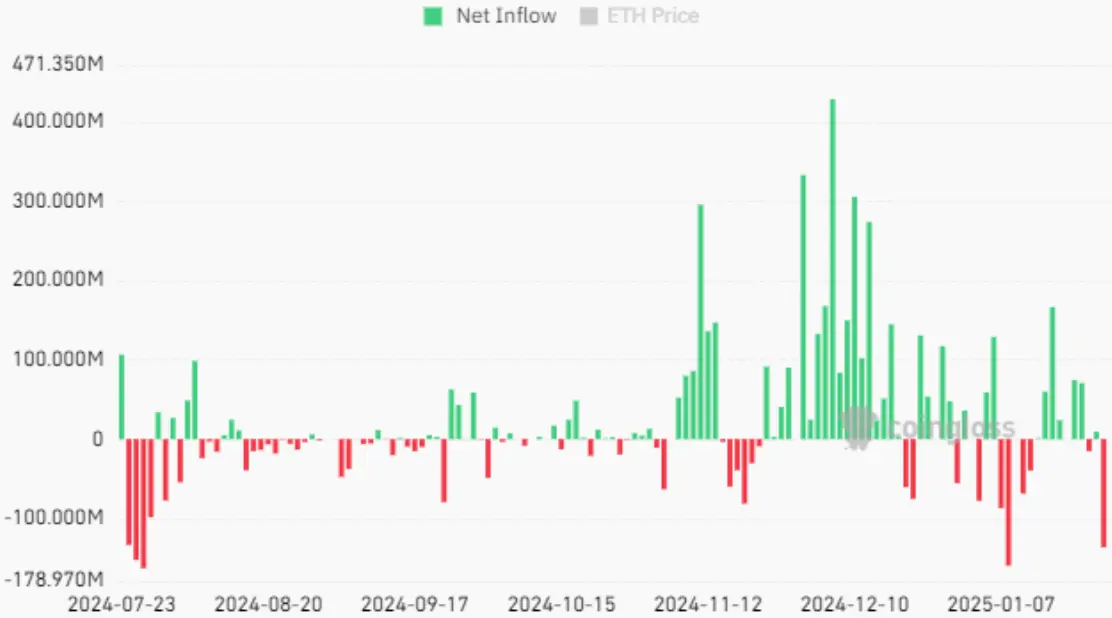
That said, average net inflows into Ethereum ETFs have been in decline in January.
Technical Analysis: Breaking Down the $4.1K Resistance

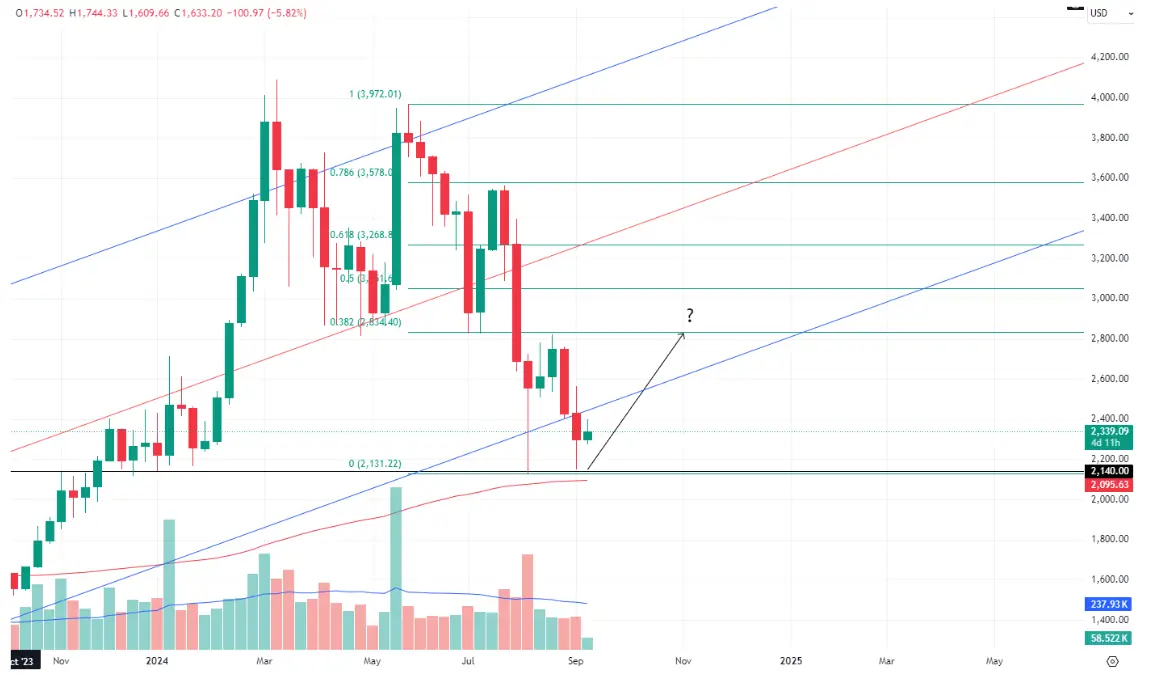
To find out which way ETHUSD is heading, investors are advised to take another look at the one-month chart.
In December 2024, ETH reached a local high slightly above $4.1k, but the bulls failed to break out of the $4.0k-$4.1k resistance range, so Ethereum moved lower.
The price action dropped to $3k, the support level (the median line of the linear regression channel). Thus, there are two possible scenarios at the moment.
Scenario A: Breaking Below $3K Support
ETHUSD breaches $3k. If this is the case, the support level will be $2.3k, the lower line of the channel.
Scenario B: Bouncing Off Support Levels
ETHUSD will bounce off support and move higher. We currently view this scenario as more plausible. In the short term, Ethereum could oscillate near $3.1k, the 200-day SMA on the short-term daily chart.