Ethereum Gains 66% in Q3, Eyes New Bullish Targets
Ethereum Delivers Its Best Quarter Since 2021
Ethereum closed Q3 with a 66.7% gain, delivering the best performance after Q1 2021 when the token shot up over 160%.
The price action hit a new ATH, while its average YTD climbed to $3,010.
Market Shock: Trump’s Tariff and Crypto’s Reaction
Last week’s standout event was President Trump’s announcement of a 100% tariff on Chinese imports, starting November 1.
This fresh round of escalation in the US-China trade war exerted downward pressure on crypto assets.
Analysts spotted the largest aggregate position closure on October 10 – including by traders who use leverage.
Glassnode pointed out that despite this major dump of cryptocurrencies, the overall market structure as well as crypto ETF inflows were little changed.
It looks like the market underwent a reset.
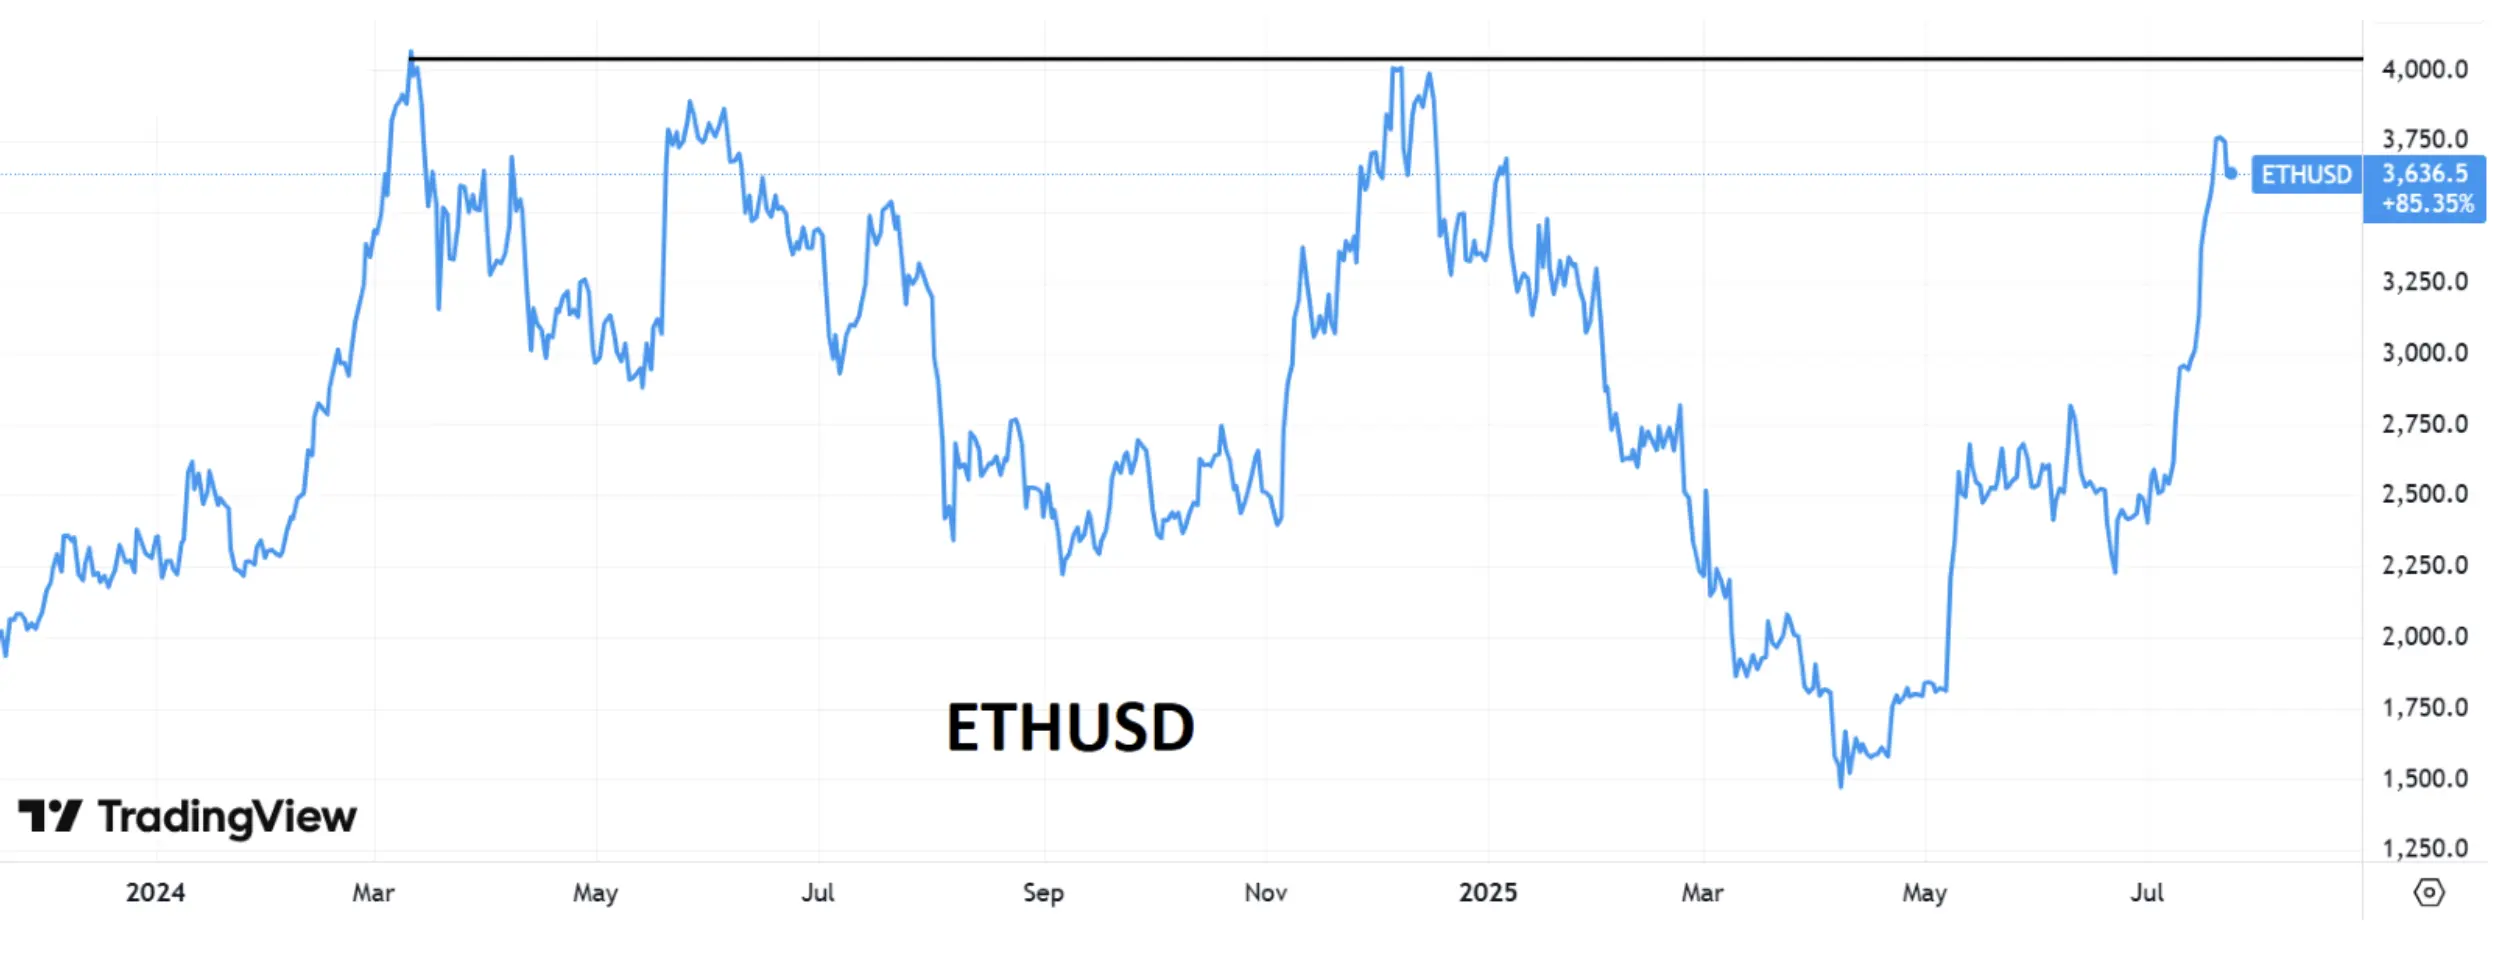
The Ethereum price dipped 12% on October 10 before rebounding over the next two sessions.
As a result, the token clawed back some of the prior losses and was last hovering around the $4,000 mark.
ETH Technical Picture: Correction and Rebound
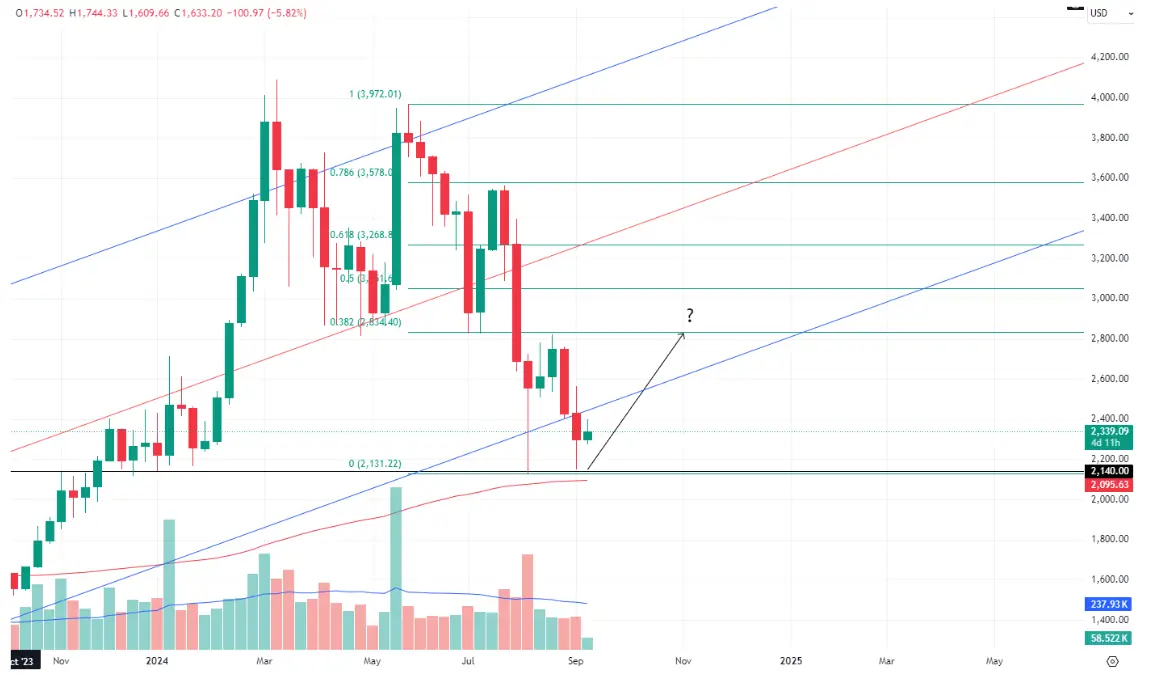
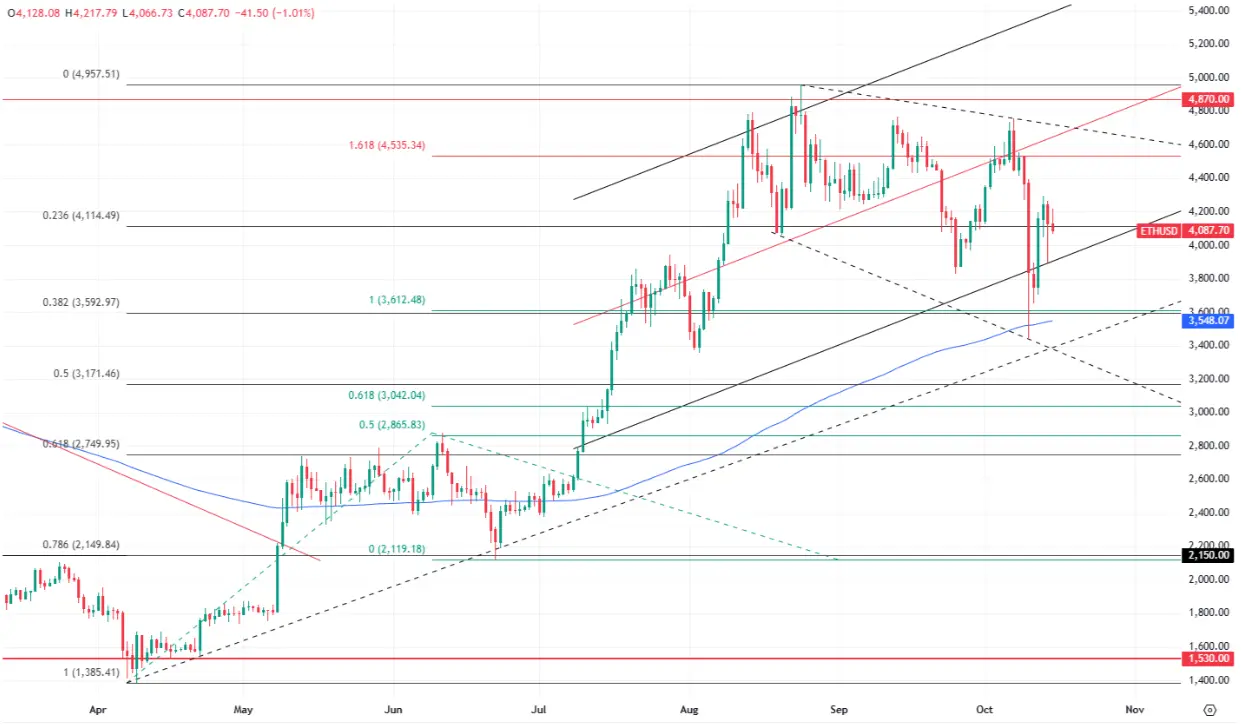
Technically, the correction scenario played out with a downside target at $3,590-3,600, which we flagged in the previous ETHUSD overview.
On the weekly chart, the price action punched through but stopped short of breaching this range.
The short-lived downturn was followed by a retracement towards $4,100, affirming that the bulls still hold the upper hand.
Bullish Outlook: Next Targets Above $4,700
The resumption and extension of the recent uptrend look more likely at this point, with the next potential target between $4,650 and $4,770.
In the event of a downward reversal, local support lies at $3,880, while a stronger threshold is located within the $3,550-3,600 range.
In the worst-case scenario, the bears could push through this price range and set their sights on $3,170 – a level we highlighted in earlier technical analysis.