BTCUSD Analysis: Growth in Q3 & October, Election Impact on Price
BTCUSD closed September with a 7,5% increase, and in October, the growth is currently around 5,5%.
Bitcoin’s Q3 Performance: A Modest 1% Gain
Considering that Q3 is behind us, we can already judge the result. Bitcoin’s growth over the past 3 months was a modest 1%.
However, even this is already better than the situation in Q2, when Bitcoin fell by more than 12%.
Crypto Market Comparison: Bitcoin vs. Other Asset Classes
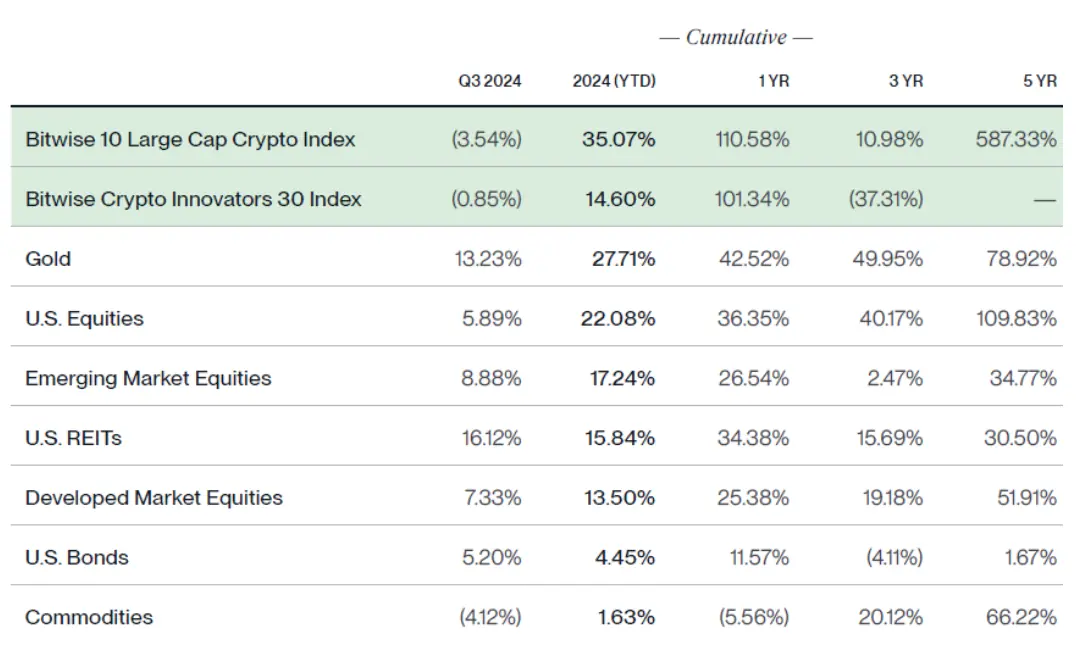
In its quarterly review of crypto markets, the American management company Bitwise also demonstrated how unsuccessful Q3 was for individual cryptocurrencies, compared, for example, with investments in other assets.
Bitwise cryptocurrency indices have decreased (the weight of Bitcoin in the Bitwise 10 Large Cap Crypto Index is over 70%).
At the same time, in annual terms, investments in cryptocurrency still outpace individual classes of alternative investments.
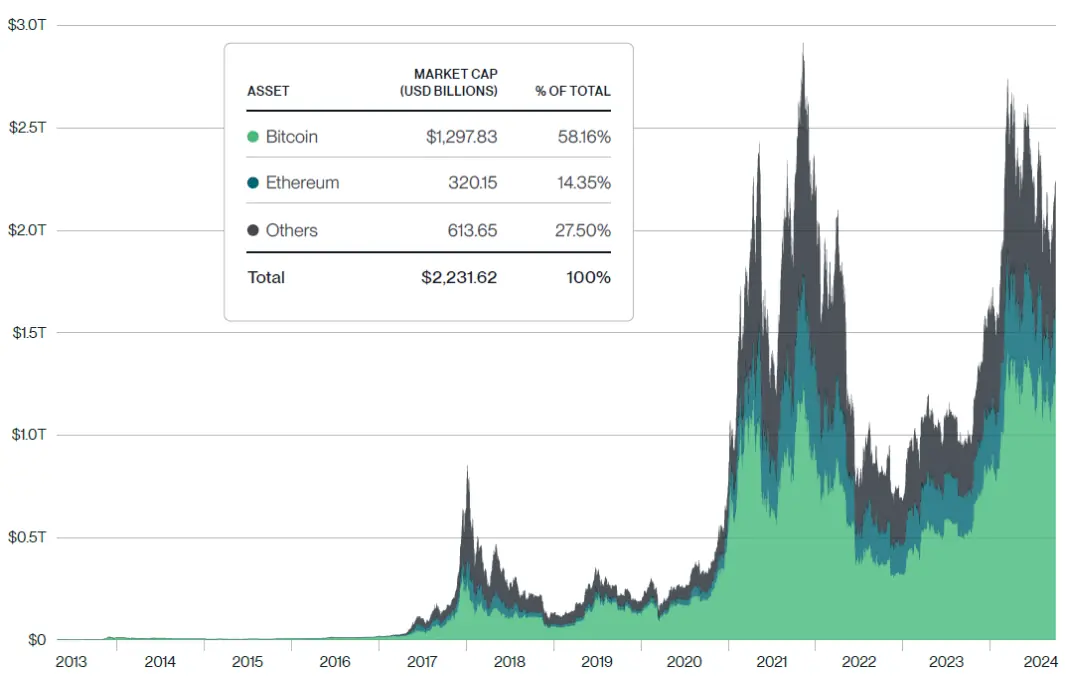
The total cryptocurrency market capitalization currently exceeds $2 trillion, of which Bitcoin accounts for almost 60%.
US Presidential Election Impact on Bitcoin Prices
Returning to the current situation, there are less than two weeks left until the US Presidential elections.
The closer the hour X, the more the market focus will be on this event, which means that the price behavior now can be largely determined by the distribution of votes between the candidates.
The market considers both Trump and Harris pro-crypto candidates. At least according to the analysis of the derivatives market, traders are expecting Bitcoin to reach the $80 000, regardless of who becomes president.
The inflow into Bitcoin ETF funds over the past few days amounted to $2,4 billion. Meanwhile, it seems that D. Trump is still a more pro-crypto candidate, which may result in more positive dynamics of the BTCUSD price if he wins.
Technical Analysis: BTCUSD Price Channel and Resistance Levels

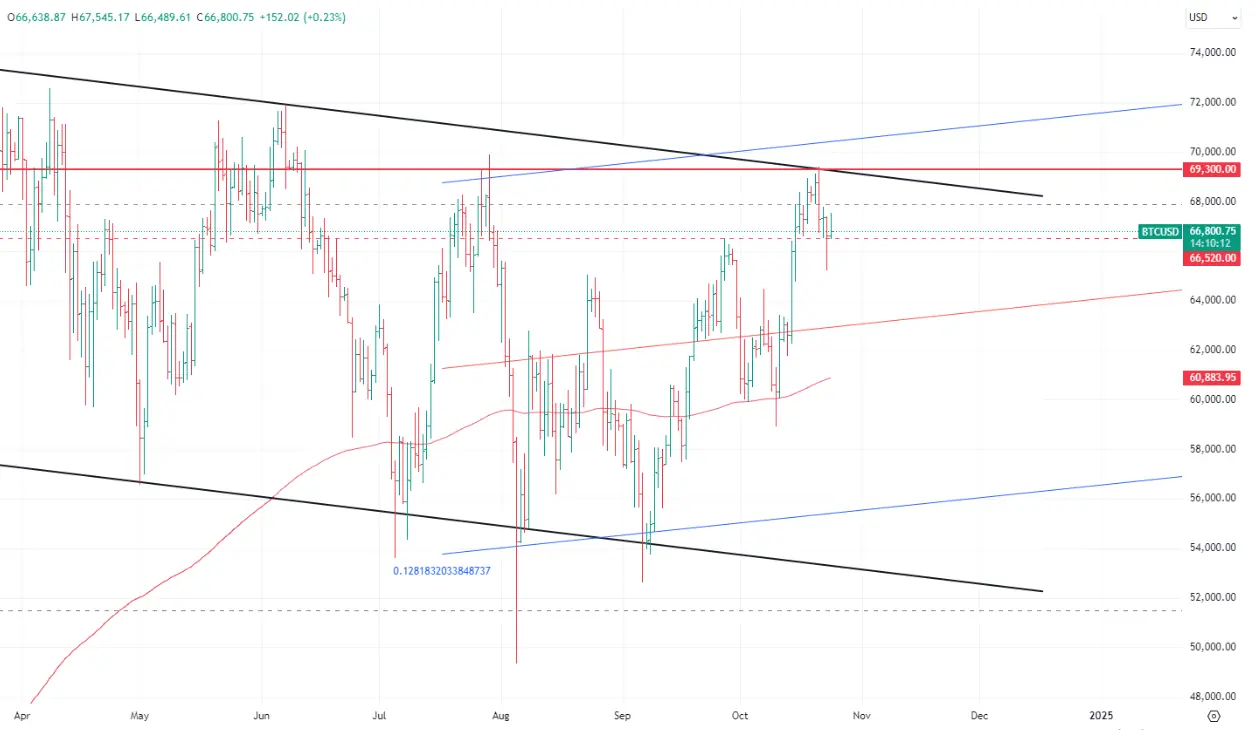
The technical picture on the daily chart has changed somewhat since our last review of BTCUSD.
Firstly, the slope of the regression price channel has changed and is currently looking up, the 200-th moving average has also reversed.
These are positive signals for bulls, as a change in the short-term trend is confirmed.
Secondly, BTCUSD broke through its local highest-highs from August and formed a new local highest-high at around $66 520.
However, there are nuances. The price reached the upper boundary of the price channel (marked with bold black lines) and the resistance cluster of $69 000 – 70 000 (the lower boundary is marked with a bold red line).
Considering that BTCUSD is at the upper boundary, a reasonable strategy would be to reduce long positions. Continuing to increase them will only be possible after a breakout above $70,000.
