
Bitcoin Surges 11% Despite Geopolitical Tensions in June
Geopolitical Tensions Drive Bitcoin Volatility
The Bitcoin price climbed 11.3% in May. The most notable period got underway in mid-June amid escalating Middle East tensions.
The token dropped over 4% during the week of June 16-20 as Iran and Israel traded airstrikes and the US prepared to enter the conflict.
Shortly thereafter, the warring parties signaled they were unwilling to escalate further and open to a ceasefire, prompting Bitcoin to rebound and retrace its recent losses.
Fear & Greed Index Signals Market Uncertainty
The Crypto Fear & Greed Index fell to 37 points by June 23 before lapsing back into neutral zone on June 24-25.
ETF Inflows Surge Despite Safe-Haven Questions
Furthermore, net inflows into Bitcoin ETFs surged to USD 588.6 mn on June 24.
This suggests that, amid the current geopolitical flare-up, investors are reluctant to view Bitcoin as a safe-haven asset.
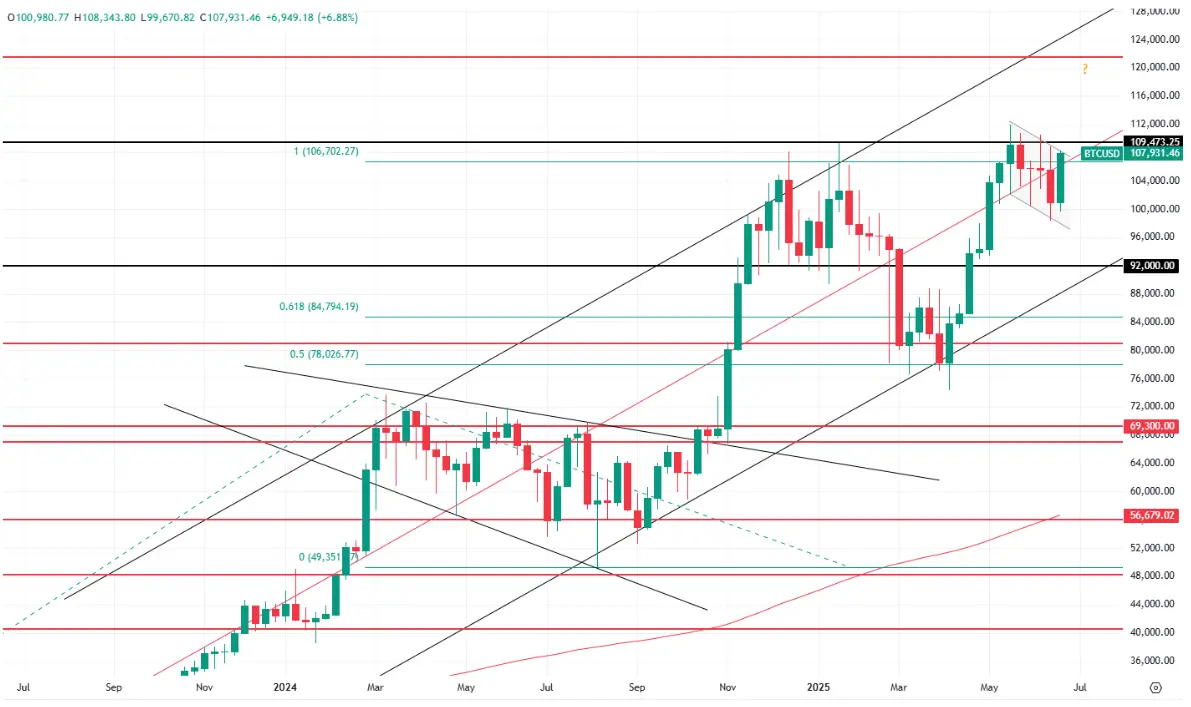
Technical Analysis Points to Bullish Flag Pattern
From the TA standpoint, the market has been steady of late. The regression channel continues to show a positive slope on both daily and weekly charts, signaling that the bulls are still fully in command.
Notably, the weekly chart reveals a corrective price channel, which can be interpreted as a bullish flag pattern, meaning that the current trend looks set to gain impetus.
Key Resistance at $109K-$110K Remains Critical
As noted earlier in our overviews, for Bitcoin to reach higher levels and then rally towards new ATHs, the bulls must first break and hold above USD 109,000-110,000.
Importantly, a single breakout could be a false dawn, as seen, for example, back on May 22.
To remind, traders should still factor in the chance of an alternative scenario envisaging a sustained Bitcoin price decline.
Confirmation of such a reversal would require a pullback towards USD 88,500 followed by a breakdown.
That said, this scenario looks unlikely at this point.
Overall, we continue to hold a moderately optimistic outlook for Bitcoin.