Bitcoin Q1 Review: Recovery Signs Amid Trade War Tensions
Q1 Performance: Bitcoin’s Challenging Start to 2025
BTCUSD fell 11.6% in Q1, with February being the most challenging month for the flagship cryptocurrency. March saw a 2.2% decline, but April has shown signs of recovery following a brief dip.
In terms of fundamentals, ongoing trade frictions continue to exert pressure on cryptocurrencies as well as other assets.
Market fears about slowing global growth due to President Trump’s protectionist policies triggered risk-off sentiment, leading to a recalibration of prospects for the crypto space.
Market Sentiment: Fear and Greed Index Analysis

The classic sentiment indicator, the Fear and Greed Index, currently stands at 29 points, reflecting sustained market tension.
The outlook has indeed improved compared to April 9, when the Fear and Greed Index tumbled to 18 points.
Analysts at Glassnode said in a recent overview that the magnitude of Bitcoin’s correction remains within typical bounds seen during previous bull runs, exhibiting a degree of resilience in the asset.
Meanwhile, the White House renewed its threats of imposing tariffs on China, potentially reaching 245%.
In response, China toned down its rhetoric, voicing willingness to engage in negotiations if President Trump shows due respect.
Technical Outlook: Elliott Wave Scenarios Revisited
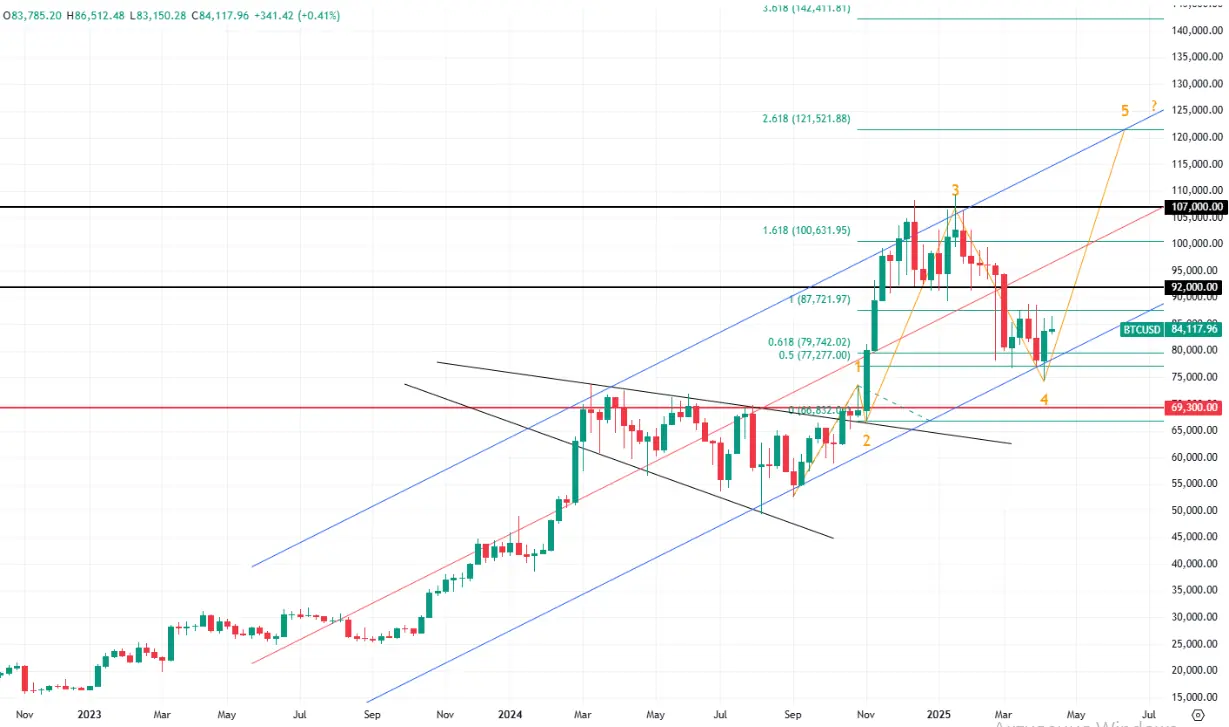
From the TA perspective, let us briefly recap our previous take on possible chart markings based on the classic Elliott wave approach.
Last time, proposed two scenarios. Under the first, we expected the upside to resume from the $76.6K level — the local low seen on March 11.
However, this forecast did not pan out. Under a competing scenario, we assumed that Bitcoin might drop below $80K again – and this is what happened during the first half of April as the Trump administrations unleashed an all-out trade war.
The price wallowed at another local nadir at $74.4K. Consequently, these two alternative scenarios are now re-emerging.
Bullish Case: Path to $140K Potential
In line with our bullish scenario, Bitcoin may complete the formation of its 4th corrective wave and resume growth.
Confirmation of this scenario could initially come from breaking past the $90K mark, although stronger confirmation would be retracing above the $109-110K range to new ATHs.
Supporting this scenario is the token’s behavior on the longer weekly timeframe, where Bitcoin rebounded from the lower end of its channel and resumed the ascent.
Should this scenario play out, the price could reach $121.5K and even exceed $140K in the longer term.
Bearish Alternative: Key Support Levels to Watch
The second scenario is on the bearish side. If the price action falls below $65-70K, it would flag the end of the local bullish trend.
This would mean that the wave markings we applied are incorrect.
In this case, Bitcoin’s target would initially be $60K, with the possibility of testing $50K in the future.
This does not mean that Bitcoin might not snap back with a vengeance, but it would surely require a major reassessment of the outlook.